
After a little experimentation I determined that it is likely to be a false sharing effect.
False sharing is where the same cache line is read/modified by multiple different threads in a loop, and can cause major performance degradation.
The counting code loop looked like this:
for(size_t i=0; i<num; ++i)
	counts[bucket_chooser(in[i])]++;
The counts buffer for each thread has 8 x 8 byte elements. Each thread sees a range of the overall count buffer.
The odd thing is, is that the per-thread count table is 64 bytes already, which is the cache-line size (unit of cachable memory) of modern CPUs. This means that the count tables for each thread are on different cache lines.
Edit: I was careful to align the per-thread count table to 64 bytes as well.
However when I added a large amount of padding between the count tables, the performance shot up.
I made a graph of padding between each 64-byte table:
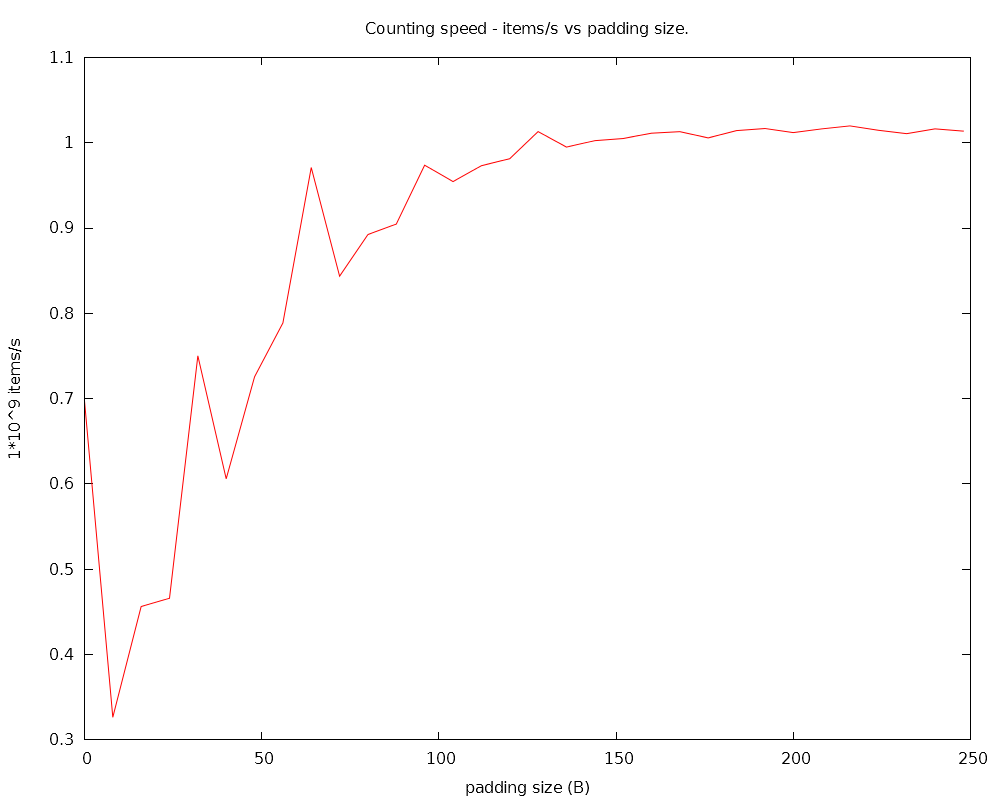
The peaks are at 0 B, 32 B, 64 B, 96 B, 128 B etc..
So it seems that to avoid false sharing effects, you need quite a lot of padding between data - something like 128 bytes, much more than the zero bytes indicated in almost all online sources.
In other words, it's not enough to just separate the cache lines that each thread works on, they must be separated by several cache-line widths.
Has anyone else seen or know about similar behaviour? CPUs are very complicated so it's possible I may be seeing some other effect, or there may be a bug in my code.
I saw a comment somewhere that the effect may be due to prefetching of adjacent cache-lines by the CPU, this may be an explanation.
Edit: Here's some C++ source code to demonstrate this effect. This is not the source used to generate the above graph, but is similar to it, and uses C++11 threading, timing etc..
#include <chrono>
#include <thread>
#include <iostream>
#include <random>


void threadFunc(const int* data_, size_t num, size_t* local_counts_)
{
	const int* const data = data_;
	size_t* const local_counts = local_counts_;

	for(size_t i=0; i<num; ++i)
		local_counts[data[i]]++;
}


void testWithPadding(const std::vector<int>& data, size_t padding_elems)
{
	auto start_time = std::chrono::high_resolution_clock::now();

	static_assert(sizeof(size_t) == 8, "sizeof(size_t) == 8");

	const int num_threads = 4;

	// Allocate memory for counts, align to 128-byte boundaries.
	size_t* counts = (size_t*)_mm_malloc(num_threads * (8 + padding_elems) * sizeof(size_t), 128);
	std::memset(counts, 0, num_threads * (8 + padding_elems) * sizeof(size_t)); // zero counts

	std::thread threads[num_threads];
	for(int i=0; i<num_threads; ++i)
		threads[i] = std::thread(threadFunc, /*data=*/data.data() + (data.size()/num_threads)*i,
			/*num=*/data.size()/num_threads, /*local_counts=*/counts + (8 + padding_elems)*i);

	for(int i=0; i<num_threads; ++i)
		threads[i].join();

	auto end_time = std::chrono::high_resolution_clock::now();
	std::chrono::duration<double> diff = end_time - start_time;

	std::cout << "padding: " << padding_elems*sizeof(size_t) << " B, elapsed: " << diff.count() << " s" << std::endl;

	_mm_free(counts);
}


void falseSharingTest()
{
	// Generate random data to count
	std::default_random_engine generator;
	std::uniform_int_distribution<int> distribution(0, 7);
	const size_t DATA_SIZE = 1 << 26;
	std::vector<int> data(DATA_SIZE);
	for(size_t i=0; i<DATA_SIZE; ++i)
		data[i] = distribution(generator);

	// Test performance with various padding sizes
	for(int i=0; i<32; ++i)
		testWithPadding(data, i);
}
Resulting output:
padding: 0 B, elapsed: 0.0312501 s
padding: 8 B, elapsed: 0.0781306 s
padding: 16 B, elapsed: 0.0625087 s
padding: 24 B, elapsed: 0.062502 s
padding: 32 B, elapsed: 0.0312535 s
padding: 40 B, elapsed: 0.0625048 s
padding: 48 B, elapsed: 0.0312495 s
padding: 56 B, elapsed: 0.0312519 s
padding: 64 B, elapsed: 0.015628 s
padding: 72 B, elapsed: 0.0312498 s
padding: 80 B, elapsed: 0.0156279 s
padding: 88 B, elapsed: 0.0312538 s
padding: 96 B, elapsed: 0.0156246 s
padding: 104 B, elapsed: 0.0156267 s
padding: 112 B, elapsed: 0.0156267 s
padding: 120 B, elapsed: 0.0156265 s
padding: 128 B, elapsed: 0.0156309 s
padding: 136 B, elapsed: 0.0156219 s
padding: 144 B, elapsed: 0.0156246 s
padding: 152 B, elapsed: 0.0312559 s
padding: 160 B, elapsed: 0.0156231 s
padding: 168 B, elapsed: 0.015627 s
padding: 176 B, elapsed: 0.0156279 s
padding: 184 B, elapsed: 0.0156244 s
padding: 192 B, elapsed: 0.0156258 s
padding: 200 B, elapsed: 0.0156261 s
padding: 208 B, elapsed: 0.0312522 s
padding: 216 B, elapsed: 0.0156265 s
padding: 224 B, elapsed: 0.0156264 s
padding: 232 B, elapsed: 0.0156267 s
padding: 240 B, elapsed: 0.0156249 s
padding: 248 B, elapsed: 0.0156276 s
It looks like VS2012's 'high resolution' (std::chrono::high_resolution_clock) clock is not actually high resolution, so feel free to replace the timing code with a proper high-resolution clock. I used our QueryPerformanceCounter-based timer in the original code.
Edit: A little more detail on the prefetching explanation - from the Intel Optimisation manual:
3.7.3 Hardware prefetching for Second-Level Cache
"Streamer - Loads data or instructions from memory to the second-level cache. To use the streamer, organize the data or instructions in 128 bytes, aligned on 128 bytes. The first access to one of the two cache lines in this block while it is in memory triggers the streamer to prefetch the pair line."
Maybe my CPU (i7 Ivy Bridge) is fetching both the cache lines to the left and to the right of the actually used cache line. This would explain the 128-byte padding seemingly needed for optimum performance.
Edit: reddit discussion here.